Does nonprofit fundraising suffer during election years?

Kamala Harris raised a record-breaking $81M in 24 hours after President Joe Biden’s endorsement. That’s nearly $3.375M per hour — $56,250 per minute, $937.50 per second. As of October, she has raised 1 billion dollars. It’s a staggering and inspiring achievement for the presidential hopeful, as well as the wider Democratic and progressive movement. But as election fundraising continues full steam in the coming months, what happens to the many non-political organizations (NPOs) that rely on those same donors? Are their contributions lost to the presidential race?
There’s a widespread concern among the NPO community that donations suffer during election cycles, as supporters are faced with making a choice between the causes they care about and the leaders they believe in. This makes complete sense at first glance. But here at Bonterra, we believe in data — and we wanted to see if the numbers tell the same story. With 16,000 nonprofits in our network, we’re uniquely positioned to pull anonymized data on political giving and compare it to NPO giving.
Below, find insights uncovered by our data science team, who shared our curiosity about election year giving trends and wanted to dig into the numbers.
Understanding giving patterns
First, a caveat: research on the impact of election years on nonprofit donations isn’t clear-cut.
Some studies suggest that political and nonprofit giving can act as complements — where increased support for one often coincides with increased support for the other. Meanwhile, other studies suggest that these forms of giving can be substitutes, with heightened political contributions potentially diminishing funds available for nonprofits, and vice versa.
So, rather than rigidly categorizing political and nonprofit donations as either substitutes or complements, we took a closer look at individual donors to understand their nuanced attitudes. The encouraging news: Among those who donate to both political and nonprofit causes, only a small fraction exhibits a clear substitutive effect. More donors either treat political and nonprofit donations as complementary — resulting in increased contributions to both — or demonstrate independent patterns in their giving.
So, what does this all mean?
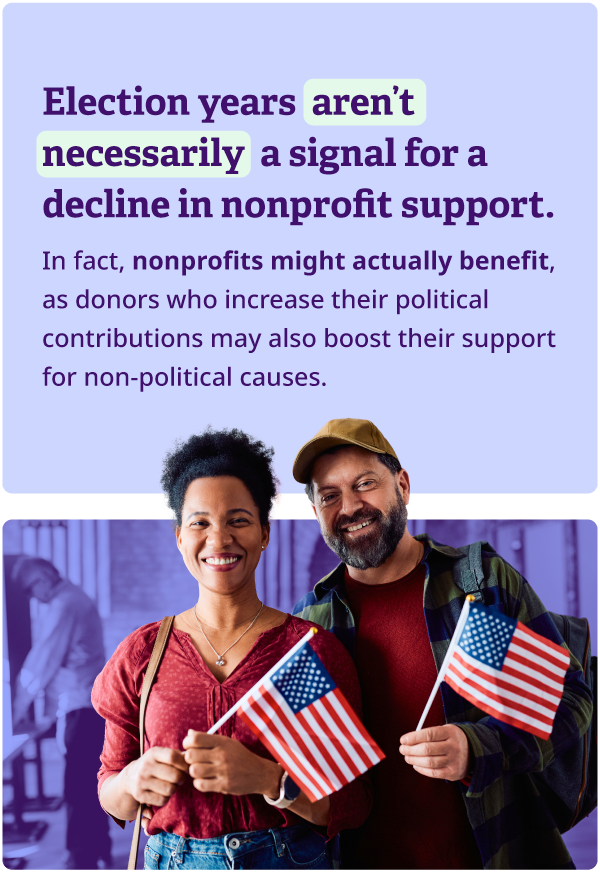
Election years aren’t necessarily a signal for a decline in nonprofit support. In fact, nonprofits might actually benefit, as donors who increase their political contributions may also boost their support for non-political causes.
Interested in a deeper dive? Here’s our approach:
To understand how donors split their contributions between political organizations and nonprofits, we looked at the giving patterns of over 130,000 donors who supported both types of organizations for at least four years. (1) We sorted these donors into three groups based on their donation habits:
- Donors who view political and nonprofit donations as substitutes: These funders tend to shift their contributions from one type of organization to the other, creating a negative correlation.
- Donors who see political and nonprofit donations as complements: For these donors, giving more to one type often goes hand-in-hand with giving more to the other, creating a positive correlation.
- Donors whose political and nonprofit giving patterns are independent: These contributors treat their donations to each type of organization separately, with no clear relationship between the two, creating a non-significant or zero correlation.
With these three groups identified, we’ll dig into the donation trends and behaviors of each. This helps us understand their motivations and how they prioritize their giving.
Donor segments behaviors
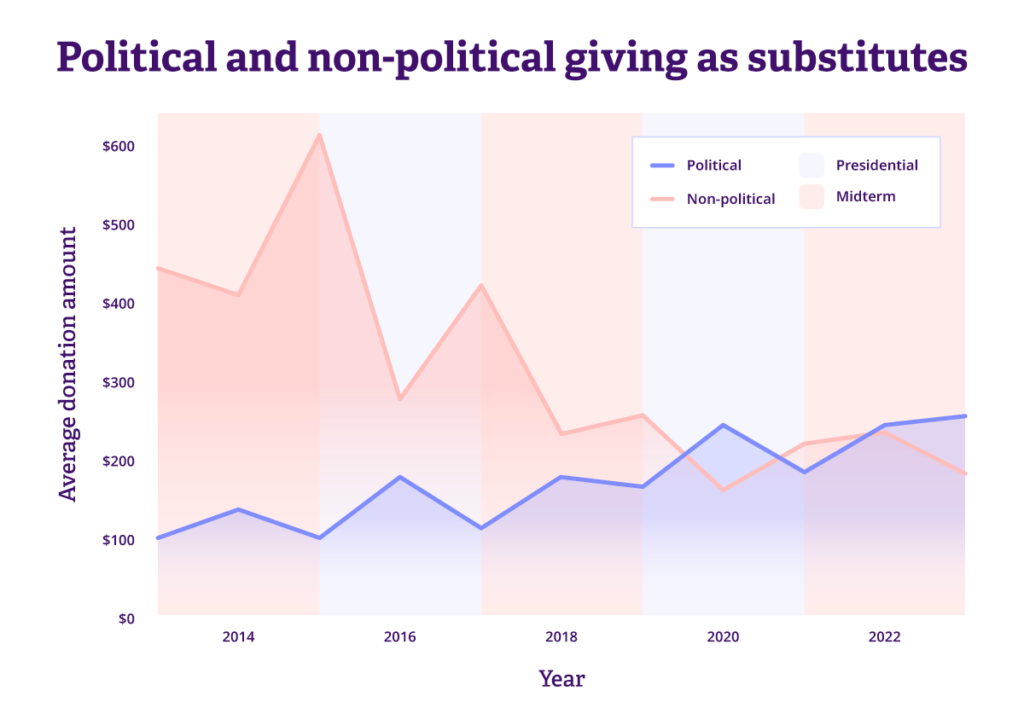
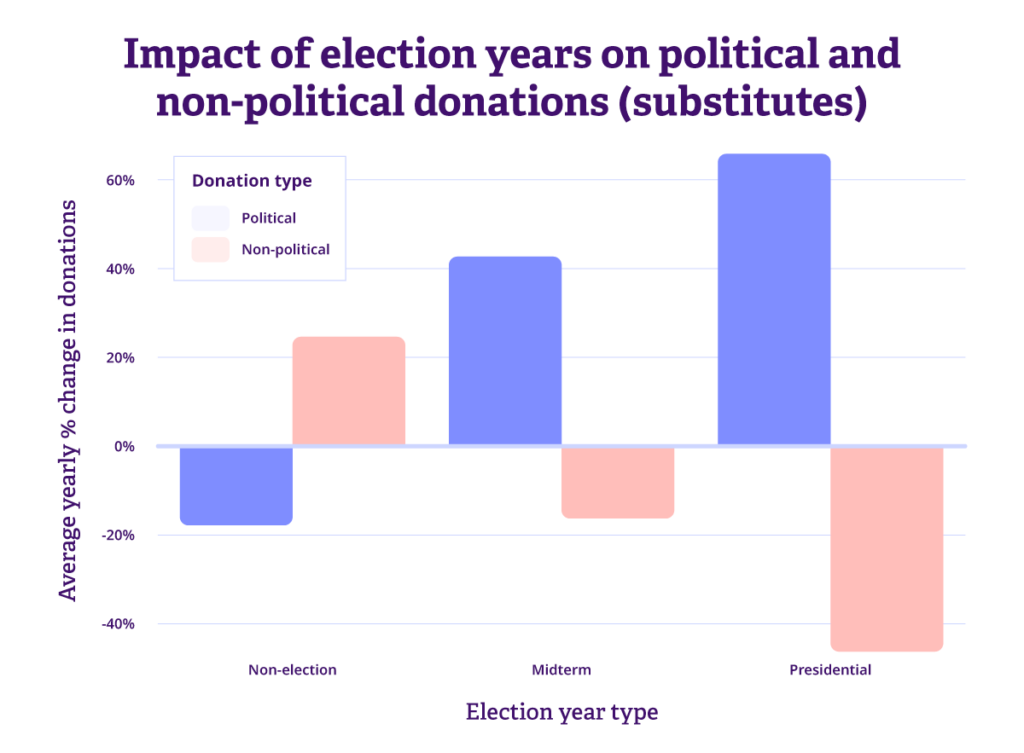
Political and non-political giving as substitutes: For donors who view political and non-political giving as substitutes, their donation patterns tend to shift with the election cycle. During election years, especially presidential ones, these donors usually ramp up their political contributions, often at the expense of their non-political donations. In non-election years, their political donations drop off, and they may redirect more funds toward nonprofits. This flip-flopping suggests that these donors adjust their focus and financial support based on the political climate.
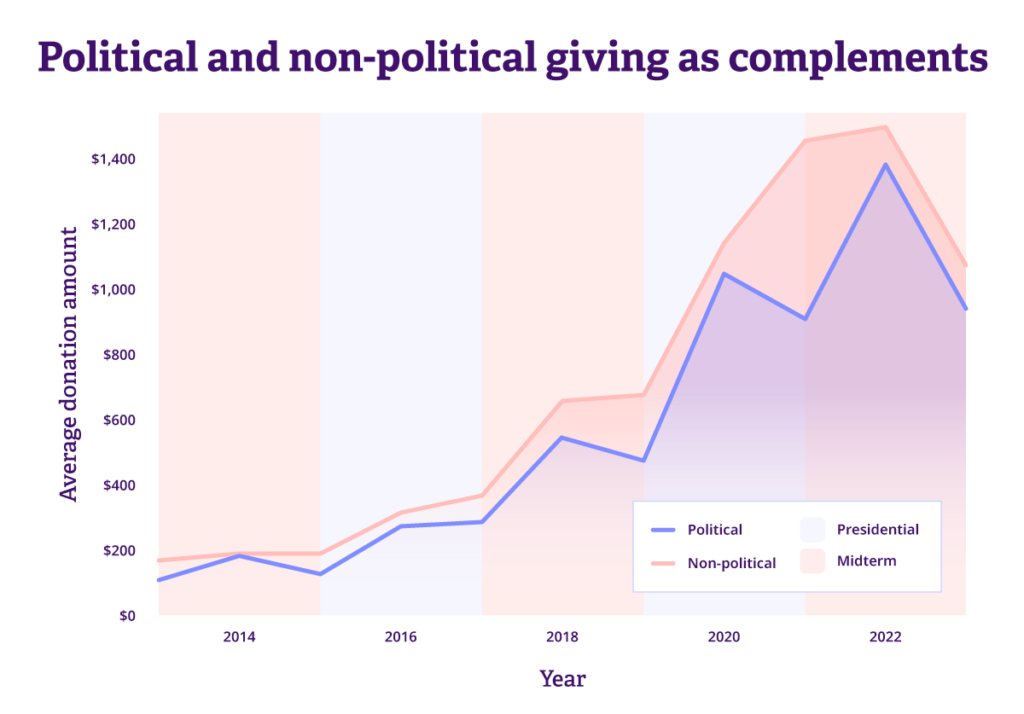
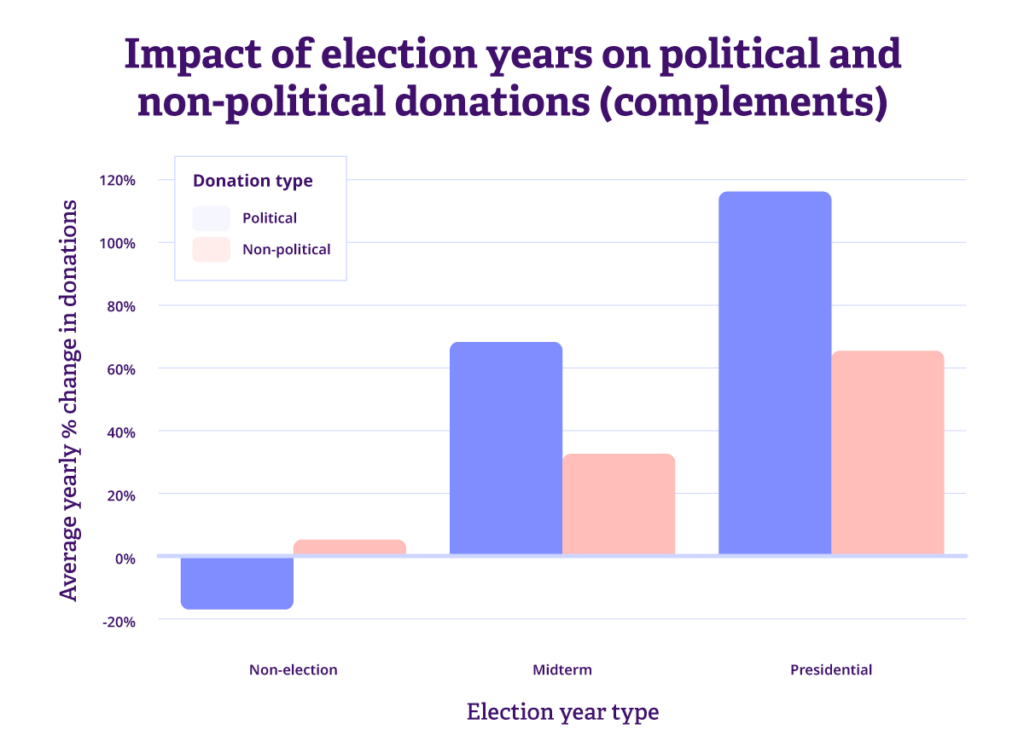
Political and non-political giving as complements: For donors who see political and non-political giving as complements, there’s a noticeable boost in both types of contributions, especially during election years. Rather than choosing one over the other, these donors tend to increase their support for both political causes and nonprofits at the same time. This pattern shows that they are committed to supporting a range of causes, even more so when the political landscape is active.
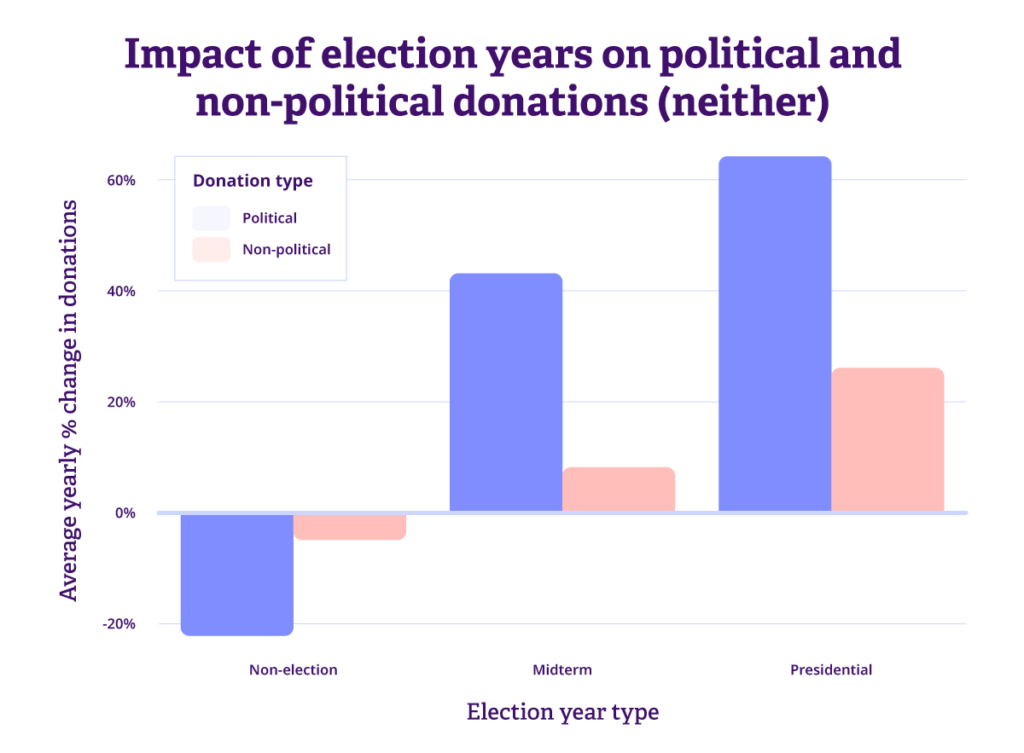
Political and non-political giving as neither substitutes nor complements: For donors who treat political and non-political giving as neither substitutes nor complements, their donation habits tell a different story. While their political contributions show the typical spikes during election years, their support for nonprofits remains steady and doesn’t fluctuate much with the election cycle. This suggests that these donors approach their political and non-political giving based on different motivations or priorities.
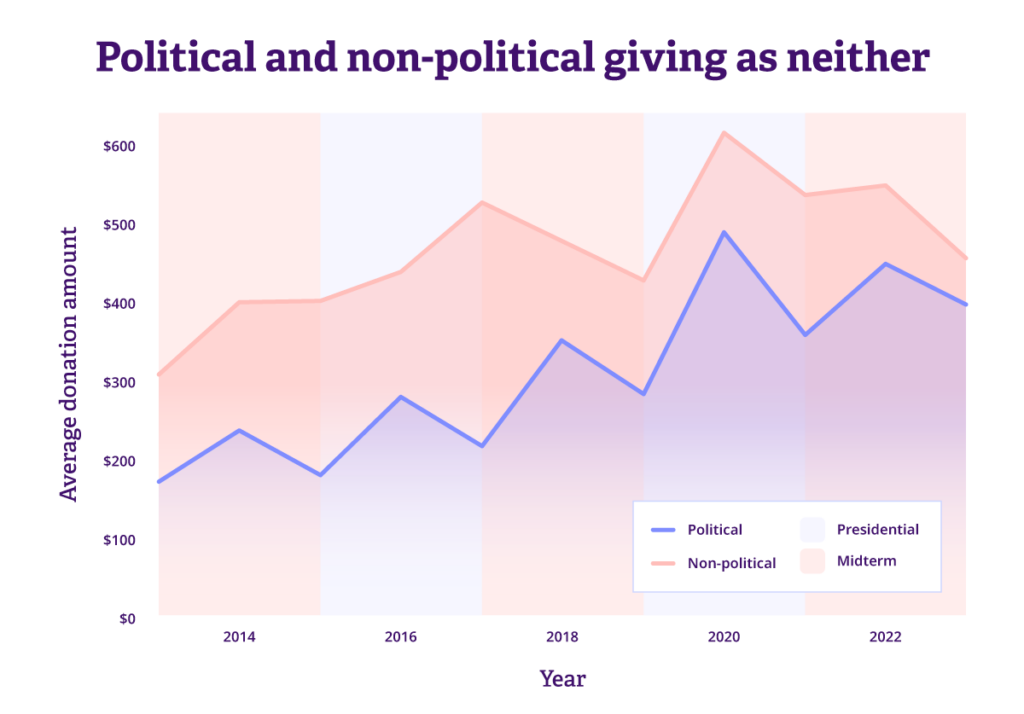
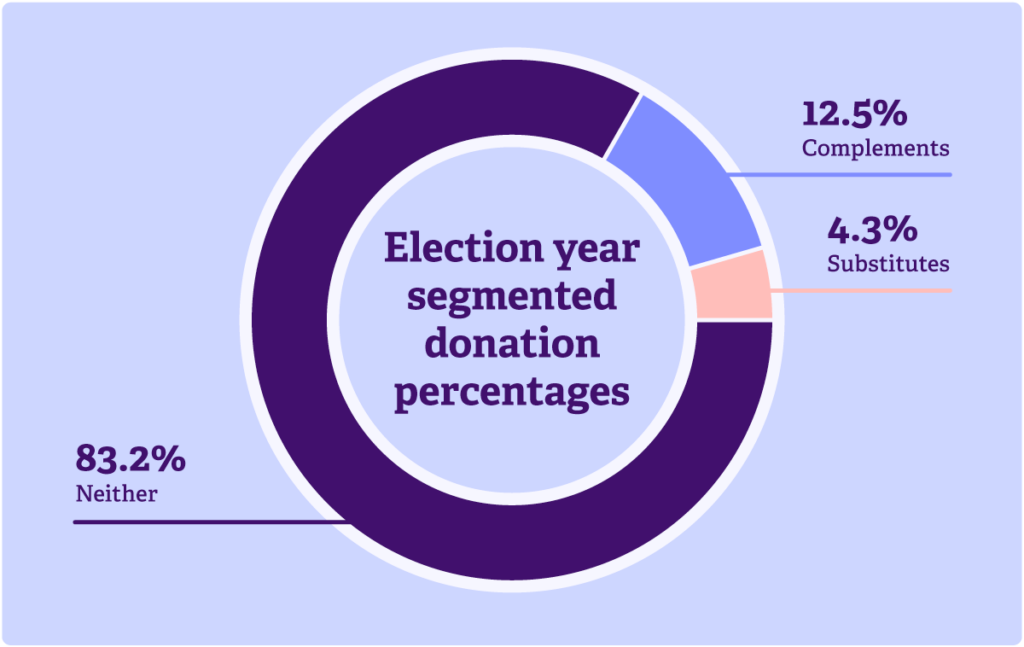
The positive takeaway from our analysis is that only 4% of donors show a substitutive effect between political and nonprofit contributions. This small percentage suggests that election years aren’t likely to significantly crowd out nonprofit donations.
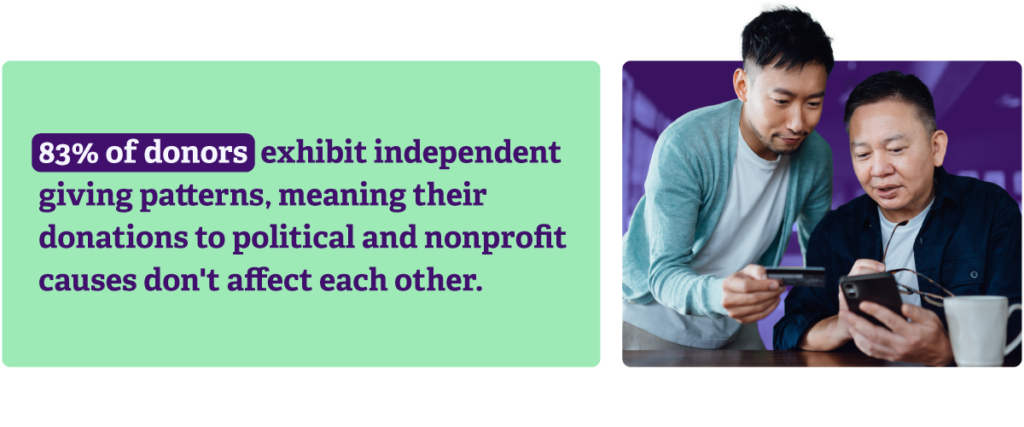
In contrast, a substantial 83% of donors exhibit independent giving patterns, meaning their donations to political and nonprofit causes don’t affect each other. They provide a steady and reliable source of support for nonprofits, largely unaffected by election cycles.
Meanwhile, up to 12% of donors treat their contributions as complements, increasing their support for both types of causes simultaneously. They’re also more inclined to boost their overall donations during election years.
To get a fuller picture of how each donor segment behaves, we also looked at their overall donation patterns beyond just their political versus nonprofit giving.
As shown in the bar plots below, the donors in the complements segment stand out for their high donation amounts, frequent giving, and broad support for various organizations. They demonstrate a strong commitment to both political and nonprofit causes. While all groups increase their contributions around election years, the complements group shows a notably larger surge.
Over time, the complements segment also reveals a growing number of supported organizations, while the substitutes segment keeps a more stable count. This difference highlights how substitute donors tend to shift their funds between political and nonprofit organizations based on the election cycle, rather than expanding their overall contributions.
The neither segment falls somewhere in between the substitutes and complements. They donate more, give more often, and support more organizations than the substitutes, but show less growth compared to the complements group.
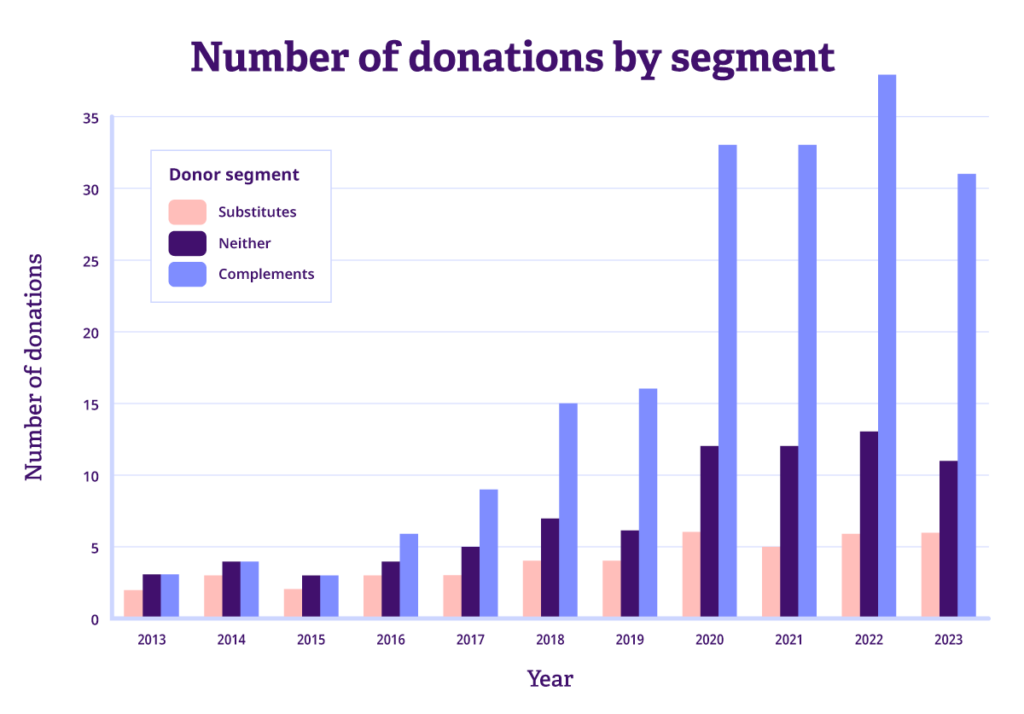
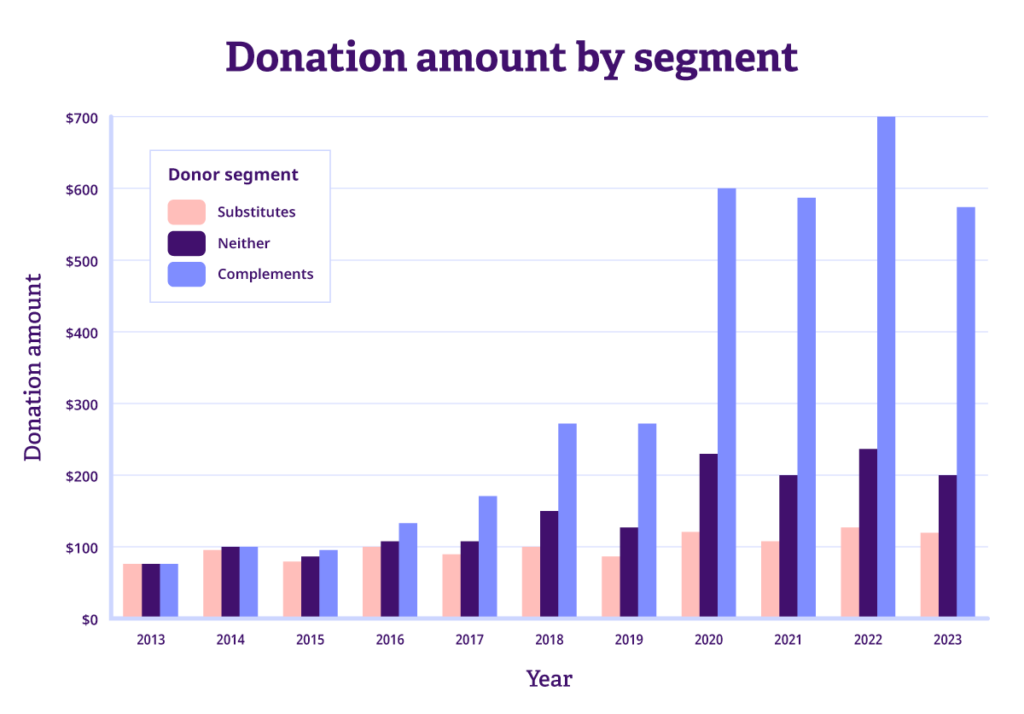
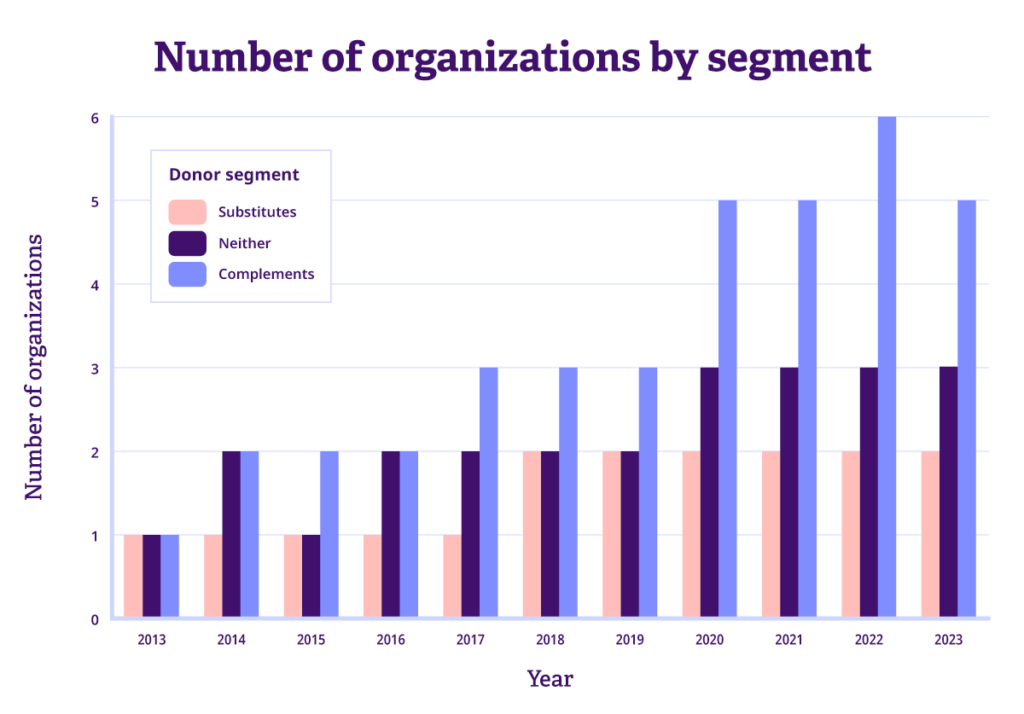
Note: The bar plots above display the median values for each metric. Trends in the median are more representative of a typical donor’s behavior.
Conclusion
Understanding how donors allocate their contributions is vital for both nonprofits and political organizations. The table below highlights the key trends and differences among the three key donor segments.
The good news is that most donors don’t exhibit a substitutive effect. In fact, many increase their nonprofit contributions alongside their political giving. This presents a valuable opportunity for nonprofits to not only maintain but potentially boost their support during election years.
| Substitutes | Complements | Neither | |
|---|---|---|---|
| Political vs. non-political donation trends | Political donations peak in election years and drop otherwise, while non-political donations decline during election years and recover post-election. This pattern suggests that these donors shift their funds between political and non-political organizations based on the election cycle, reducing non-political donations as they increase political donations, and vice versa. | Consistent increase in both political and non-political donations, especially during election years; these donors support both types of organizations simultaneously, increasing their political contributions alongside their political donations. | Political donations spike every election year, while non-political giving remains more stable, showing smaller changes each year and not correlating as much with election cycles; this suggests that political and non-political contributions are driven by different motivations or priorities. |
| Donation amount | Generally increases around elections; may decrease in non-election years. | Consistently higher overall; significant increase around election years, showing steady growth. | Shows moderate increase in donation amounts over time; more than the substitutes segment but less than the complements segment. |
| Number of donations | Tends to increase around elections; variable in non-election years. | Steadily increasing; consistently higher frequency of donations, especially during and after election years. | Donates more frequently than the substitutes segment, but less than the complements segment; shows moderate growth over time. |
| Number of organizations | Supports fewer organizations overall; relatively stable. | Supports a greater and growing number of organizations, reflecting broader engagement. | Supports a higher number of organizations than the substitutes segment, but less than the complements segment; relatively stable but with gradual increases over time. |
1. Further details about our data:
We analyzed a total of 134,740 donors who donated to political organizations over at least four years and to non-political organizations over at least four years. The years of donation do not have to be consecutive. Our data covers the period from 2013 onwards, with the year 2024 omitted since it has not ended yet. We utilized a panel approach to ensure our analysis was based on stable organizations. Business units were used as proxies for political and non-political organizations, though it is important to note that many nonprofits are politically aligned. For example, while Planned Parenthood is not classified as a political organization since it does not raise funds for a candidate running for office, its fundraising is significantly influenced by political cycles due to the issues it addresses.
2. Further details about our segmentation criteria:
For each donor, we calculated the Spearman correlation between their yearly political and non-political donation amounts. We used the following criteria to classify donors into the three segments:
- Substitutes: Donors with a statistically significant (p-value < 0.05) negative correlation between their political and non-political donations.
- Complements: Donors with a statistically significant (p-value < 0.05) positive correlation between their political and non-political donations.
- Neither: Donors with a non-significant correlation (p-value ≥ 0.05) or zero correlation, indicating that their political and non-political giving patterns are more independent of each other.
Note that we applied the Spearman correlation because, compared to other methods like Pearson correlation, it is less sensitive to outliers and better captures non-linear relationships, which is important since giving trends are not necessarily linear.
Bonterra’s data science team is constantly recovering up-to-date information about philanthropic trends, during presidential election years and every year. Whether or not you plan to give this year, make your voice heard on voting day. It’s incumbent on each donor, volunteer, and voter to create the greatest good.
Guided Fundraising
Work with Bonterra


